Website Uptime Monitor
Monitor all your websites from one Odoo dashboard: live HTTP status in green, orange or red at a glance.


Présentation du module

/ Odoo 20 · Monitoring
Website Uptime Monitor
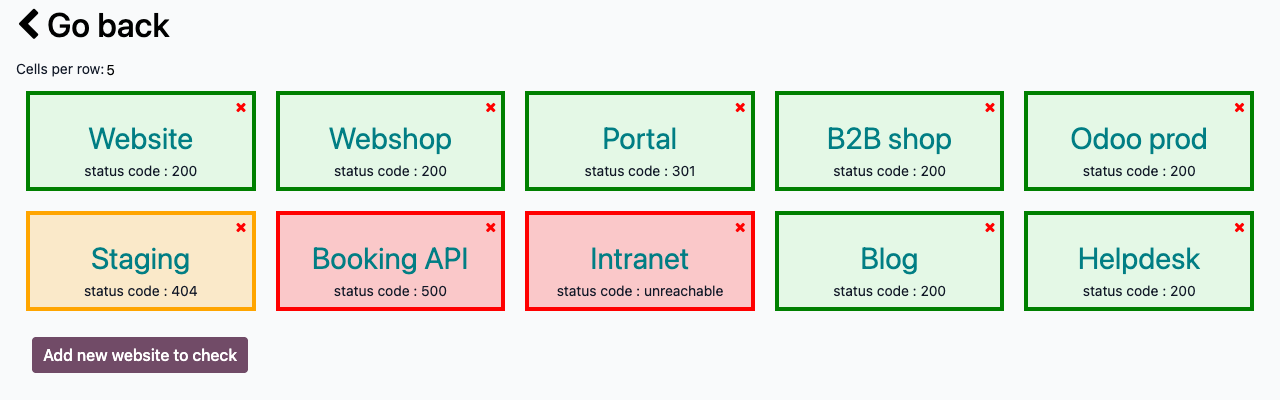
One screen with every website you look after. While the dashboard is open, Odoo calls each URL every 10 seconds and colours its card: green when it answers, orange on a client error, red on a server error or when the site cannot be reached.

What it does
All your sites, at a glance
Customer webshops, your own website, Odoo instances, APIs: see in one look which ones answer and which ones need you.
Colour-coded status
Each card shows the HTTP status code. 2xx and 3xx turn green, 4xx orange, 5xx red.
Down sites turn red
DNS failure, refused connection, SSL error or no answer within 5 seconds: the card turns red with the status unreachable, and the other cards keep refreshing.
Made for a wall screen
The dashboard opens full screen. Choose how many cards per row to fit your TV or second monitor.
Any URL, no extra service
The checks run from your Odoo server. No third-party monitoring account, nothing to install on the sites you watch.
Setup
Add a site, watch it
1
Open Websites health
A new app on the home screen, available to all internal users.
2
Add your websites
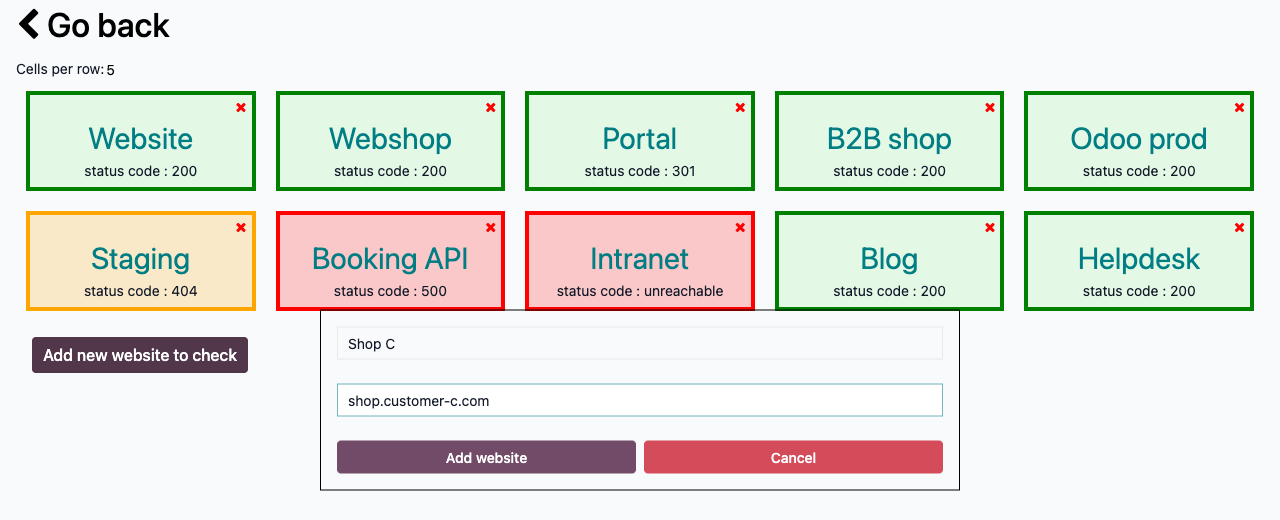
Click Add new website to check, enter a name and a URL. https:// is added when you leave it out.
3
Keep it on screen
Statuses update every 10 seconds while the dashboard is open. Remove a site with its red cross.
Under the hood
How the check works
A live view, not an alerting tool
The checks only run while someone has the dashboard open. There is no scheduled check, no history and no e-mail or notification when a site goes down. Put it on a screen your team watches; if you need alerts at night, pair it with a dedicated uptime service.
A question? A problem? Talk to the people who built it.
We will get back to you within 8 business hours.

Email us directly at
Published by
Nalios — Odoo Gold Partner, Belgium — nalios.be